


Data science, for the love of it
Will Millwall win the Championship?
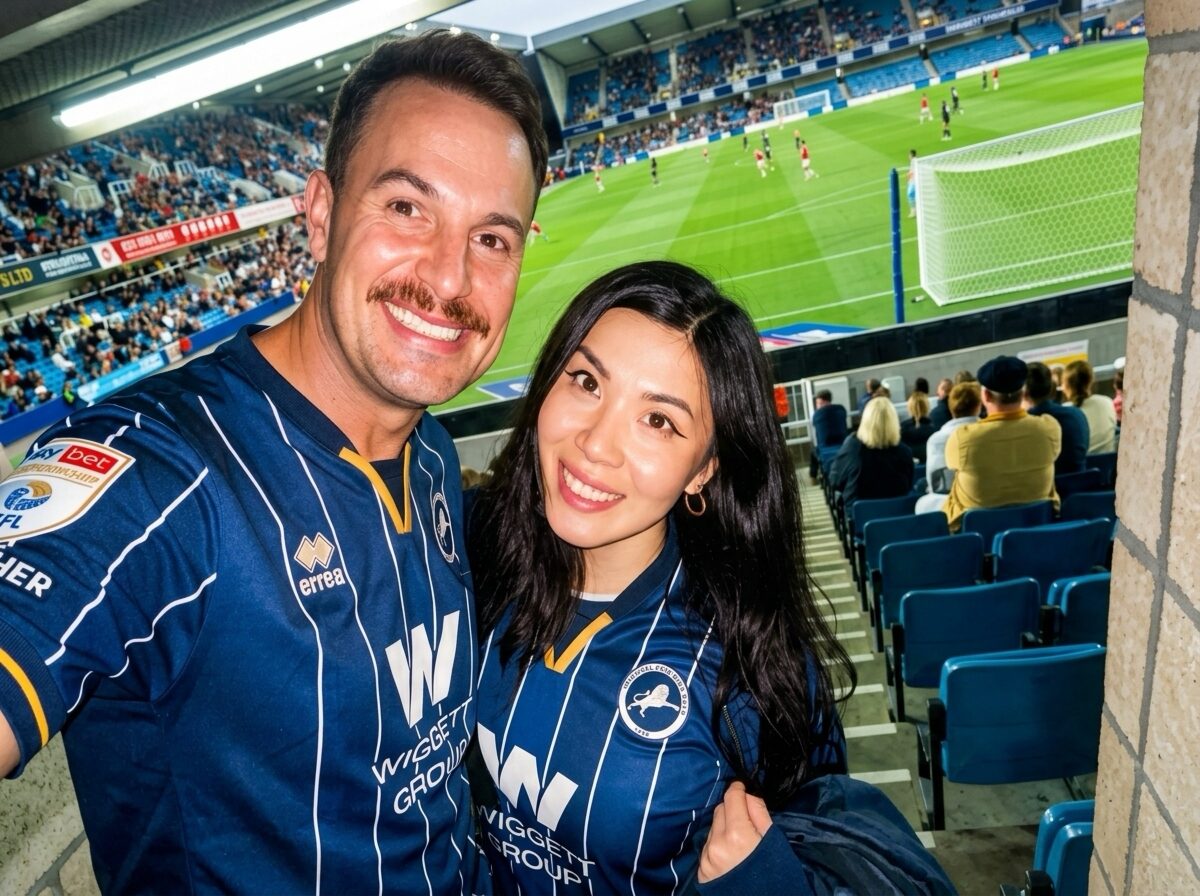
I have three great passions: data science, flying, and Millwall Football Club.
By admitting that last one I have just lost the majority of my target market. But as we say down at The Den: you don’t like me, I don’t care.
Just kidding. I genuinely appreciate you being here, and I appreciate even more that whoever you support, we are all united by the same daft, wonderful love of football.
So I pointed my other passion at this one. Below is an honest, living model of Millwall’s promotion chances, built up in four steps from a naive coin-flip to a full Monte Carlo simulation of the rest of the season. It refreshes around every matchday, and yes, I take the numbers personally.
0.0%
chance of promotion this season (top 6)
The matchday update
After 8 games we're sat on 11 points in 12th, right in the middle of things with a goal difference of zero, which tells you everything about how tight this has been. We've drawn with West Ham and Middlesbrough lately, but lost to Blackburn and Wrexham either side of that lovely 4-0 demolition of Bolton, so the form is a bit of a rollercoaster really. Come on you Lions, Preston away on Saturday is exactly the sort of match where we need to be at our sharpest if we're going to climb into that top 6 where our model gives us just a 16.4% chance right now.
Next up: away at Preston North End FC · Saturday 10 October
Current position
12.
of 24
Projected finish
11.
range 5–18
Projected final points
65
55–75
Last five
Recent results weighted higher through an Elo-style update, then 20,000 simulations of the rest of the season. This is the headline number.
0.3%
Win the title
1.3%
Automatic promotion
16.4%
Reach the playoffs
Each figure is the share of 20,000 simulated seasons in which that outcome happened. Promotion means top two (automatic) or top six (through the playoffs); the title means finishing first.
Where the simulation says we finish
Hover or tap a bar
11th7.7%· most likely
The table today
| Pos | Team | GD | Pts |
|---|---|---|---|
| 1 | Swansea City | +7 | 17 |
| 2 | West Ham United | +11 | 15 |
| 3 | Middlesbrough | +4 | 15 |
| 4 | Southampton | +9 | 14 |
| 5 | Wolverhampton Wanderers | +5 | 14 |
| 6 | West Bromwich Albion | +2 | 14 |
| 7 | Queens Park Rangers | +3 | 13 |
| 8 | Stoke City | +1 | 13 |
| 9 | Bristol City | -1 | 13 |
| 10 | Charlton Athletic | -3 | 12 |
| 11 | Birmingham City | +1 | 11 |
| 12 | Millwall | 0 | 11 |
| 13 | Lincoln City | -1 | 11 |
| 14 | Wrexham | -3 | 10 |
| 15 | Bolton Wanderers | -4 | 10 |
| 16 | Blackburn Rovers | 0 | 9 |
| 17 | Norwich City | -1 | 9 |
| 18 | Sheffield United | -2 | 9 |
| 19 | Portsmouth | -1 | 8 |
| 20 | Watford | -3 | 8 |
| 21 | Cardiff City | -2 | 7 |
| 22 | Derby County | -7 | 5 |
| 23 | Preston North End | -7 | 4 |
| 24 | Burnley | -8 | 4 |
Projected final table
| Pos | Team | xPts |
|---|---|---|
| 1 | West Ham United | 84 |
| 2 | Swansea City | 83 |
| 3 | Wolverhampton Wanderers | 79 |
| 4 | Southampton | 79 |
| 5 | Middlesbrough | 74 |
| 6 | Queens Park Rangers | 71 |
| 7 | West Bromwich Albion | 70 |
| 8 | Stoke City | 70 |
| 9 | Millwall | 65 |
| 10 | Birmingham City | 65 |
| 11 | Bristol City | 63 |
| 12 | Charlton Athletic | 62 |
| 13 | Blackburn Rovers | 61 |
| 14 | Lincoln City | 61 |
| 15 | Norwich City | 60 |
| 16 | Portsmouth | 60 |
| 17 | Sheffield United | 58 |
| 18 | Wrexham | 58 |
| 19 | Bolton Wanderers | 57 |
| 20 | Cardiff City | 54 |
| 21 | Watford | 53 |
| 22 | Derby County | 45 |
| 23 | Burnley | 45 |
| 24 | Preston North End | 44 |
Each team’s average points across 20,000 simulated seasons, ranked. The most likely shape of the final table, though every line carries a wide band.
How the model works
- 1
Naive prior
No knowledge at all: 24 teams, so a flat 1 in 24. The baseline every model must beat.
- 2
Team strength
Attack and defence ratings from goals scored and conceded, with home advantage, then a full season simulated from scratch. Position-blind.
- 3
+ Current standings
Keeps the points already on the board and simulates only the remaining fixtures with those strength ratings.
- 4
+ Form & simulation
Recent results weighted higher through an Elo-style update, then 20,000 simulations of the rest of the season. This is the headline number.
The data science, and why
Poisson goals model
Football goals follow a Poisson process closely enough to be useful, so each team’s scoring is a Poisson rate built from goals scored and conceded versus the league average, plus a home-advantage term. It is the workhorse of football forecasting: transparent, fast, and hard to overfit.
Shrinkage (a light prior)
Six games in, raw scoring rates are noisy. I pull each strength toward the league average with a small Bayesian-style prior, so one 5-1 does not hijack the whole forecast. It fades as real games accumulate.
Elo-style form
A season average treats August and last Saturday the same. An Elo update nudges each rating by how surprising a result was, letting recent form count for more without discarding the base rate.
Monte Carlo simulation
There is no tidy formula for “probability of finishing top six” once every remaining fixture and tie-breaker is in play. So I simulate the rest of the season 20,000 times, sampling each scoreline from the Poisson rates, and count how often Millwall land in each position. This is how FiveThirtyEight’s SPI and Opta’s supercomputer work.
Layered on purpose
Each tab adds exactly one idea, so you can watch the estimate move from a naive prior to a full simulation. A model you cannot explain is a model you should not trust, and I would rather show my working.
Honest limitations
- Goals, not expected goals. Free xG data does not exist for the Championship, so the model learns from actual goals. Goals are noisier than xG, so early-season numbers swing a lot.
- No context. It knows nothing of injuries, suspensions, transfers, new managers, fixture congestion or a derby-day mood. A key striker out until May only shows up once the results do.
- Independence assumptions. Poisson treats goals as independent; real games have state effects (2-0 up and cruising). Dixon-Coles corrects the very low scores; the rest is accepted noise.
- The table is not destiny. With most of the season to play, the bands are wide on purpose. The single number is the centre of a range, not a promise.
- It is for the love of it. A personal project to show the method honestly. Not a betting model, not affiliated with the club.
The real thing
This is my model, not the club. For the actual Lions, the fixtures, the tickets and the news, go to the source. And if you fancy it, the shop does a lovely shirt (Poling can vouch for it).
Fixtures, results and standings from football-data.org, refreshed around each matchday. Goals-based model (free expected-goals data does not exist for the Championship). A personal project, not affiliated with Millwall FC, and absolutely not betting advice.
07/10/2026 · 2026/2027 · 95 played